
How reliable are self-reported measures of social media use? Lots of studies rely on them, but it’s well-known that self-reported behaviors can be noisy. This paper studies how noisy by comparing the results from 10 self-reported questions with actual usage data from Facebook server logs.
Authors: Sindhu Kiranmai Ernala, Moira Burke, Alex Leavitt, Nicole B. Ellison
Link: ACM DL
Background and motivation
Measuring how much people use different technologies is clearly important; that’s Nielsen’s entire business. But, for many reasons, scientists often have to use self-reported survey measures of media use (e.g., “how much did you use Facebook in the past week?").
Self-reports are known to be noisy. People might not remember, might underreport or overreport based on which is seen as more desirable, might be primed to respond a certain way, or might be cognitively overloaded. “Measurement validity”—that this kind of question is actually a reasonable way to measure the thing it’s trying to (Facebook usage)—is an important concern.
This paper evaluates 10 different self-reported time-spent questions about Facebook usage by comparing participants’ answers to their actual usage from Facebook server logs. That is, it takes the results to questions like “How much did you use Facebook in the last week?” and sees how accurate they actually are.
Methods
The authors asked one of ten questions:
- How many hours a day, if any, do you typically spend using Facebook? (open text)
- In the past week, on average, approximately how many minutes PER DAY have you spent actively using Facebook? (open text)
- In the past week, on average, approximately how much time PER DAY have you spent actively using Facebook? (__ hours __ minutes)
- In the past week, on average, approximately how much time PER DAY have you spent actively using Facebook? (multiple choice)
- On average, how many times per day do you check Facebook? (open text)
- How many times per day do you visit Facebook, on average? (multiple choice)
- How much time do you feel you spend on Facebook? (multiple choice: “definitely too little”, “somewhat too little”, etc.)
- How much do you usually use Facebook? (multiple choice: “not at all”, “a little”, “a moderate amount”, etc.)
- How much do you usually use Facebook? (slider from 0 to 100)
- How much do you usually use Facebook? (multiple choice: much less, somewhat less, about the same, etc. as most people)
Participants (N = 49,934) were recruited via a message at the top of their Facebook News Feeds on web and mobile interfaces. The survey was targeted at random samples of people on Facebook in the following 15 countries: Australia (N = 630), Brazil (8930), Canada (858), France (2198), Germany (785), India (4154), Indonesia (2812), Mexico (8898), Philippines (1592), Spain (1780), Thailand (3289), Turkey (2418), United Kingdom (1425), United States (5682), and Vietnam (4483).
The researchers matched the participants’ responses to their Facebook usage from the past 30 days of server logs, which was de-identified after matching. They collected the number of daily minutes and daily sessions. Using different thresholds for what constitutes a session (60 or 300 seconds between them, including Messenger or not) didn’t qualitatively change the results.
This did lead to selection bias:
Respondents were 1.1 years younger, 5% more likely to be female, had 55% more friends, spent 115% more time on the site in the past month, and had 14% fewer sessions in the past month (all p < 0.001).
This is a limitation of this work (the 115% more time stands out in particular!), but I think it’s still useful with that caveat.
Results
The results are … really bad! People are awful at judging their Facebook usage! Question 2 had a mean absolute error of nearly 90 minutes. Question 3 had a mean absolute error of over 4 hours! Correlations between actual and self-reported usage were between 0.23 and 0.42, indicating that these results are noisy indicators.
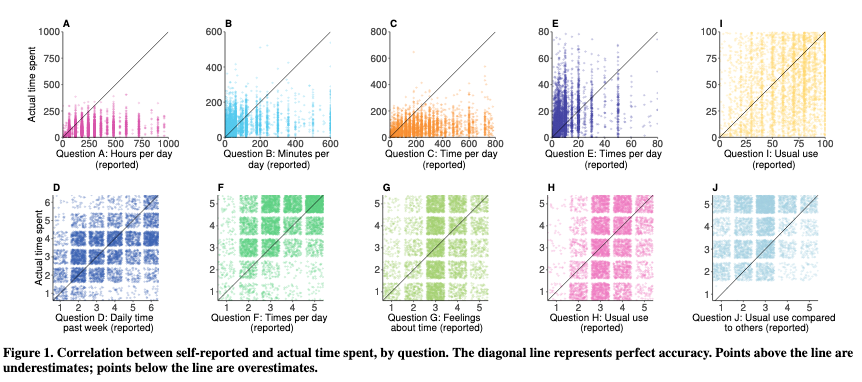
(Note that I relabeled questions A - J as 1 - 10 in the list above.)
Other notes about the errors:
- teens and young adults had more error than other groups
- across all questions there was no difference in error between women and men
- there was difference across countries; Thailand and the Philippines (which both had the most error) had about twice as much as France, Australia, and the UK (which collectively had the least)
One of the best-performing questions was “In the past week, on average, approximately how much time PER DAY have you spent actively using Facebook? (multiple choice),” which had 27% of participants selecting the correct choice, and the mean absolute error being just 1.2 bins away (i.e., on average participants chose an answer bin adjacent to the correct one). This question had no relationship between error and actual time spent, which is desirable!
The authors dive deeper into results from this question and two others, examining specific properties of the responses (error based on age, error across different countries, over- vs. under-reporting, etc.).
Recommendations for researchers
The authors make recommendations to future researchers aiming to measure time spent on Facebook—
- use time tracking applications, which on modern phones are built into the OS (Apple’s Screen Time or Android’s Digital Wellbeing)
- when time spent must be self-reported, use the multiple choice question that performed the best here
- use multiple choice questions where possible (which might mean doing pilot studies to figure out what answers you need)
- (importantly) interpret people’s self-reported time as a noisy estimate for where they fall … relative to other respondents, instead of using the values directly.
Using a stable set of measures helps ensure that the measurements are valid in the first place, and also for meta-analyses in the future. The authors give the example of the Facebook Intensity Scale, which was originally created for undergrads at one institution before the News Feed was even launched; but the measure has been used regularly in different contexts and populations without establishing its validity.
Thoughts
This was one of the easier papers I’ve read lately, which feels like a nice mental break. The question is so simple—“how accurate are people when you ask them how much they’ve used Facebook?"—and while I knew that self-reported survey measures weren’t always accurate, I had no idea that it’d be this noisy.
It’s a little unsettling to see the kind of research that’s only possible in industry (or via industry collaborations). If Facebook had not been interested in doing this study, it simply wouldn’t have been possible (due to both the server logs and participant recruitment).
It’s also worth noting (and the authors do call this out) that “time spent” is often itself not a meaningful metric, and might be a proxy for other things that are harder to quantify, like the role social media plays in someone’s life, the exposure they have to different things happening on Facebook, or the impact of Facebook on well-being.
Nonetheless, I appreciate this for helping to develop best practices in the field. Noisy indicators are still useful, but should be used differently than precise measurements. I hope that more of the big players in industry advance this kind of work going forward.