
I’m hoping to get back into a routine of reading papers after a crazy couple of weeks; this is the first of hopefully many. This is a paper to appear at CHI 2020 (with an Honorable Mention!) about the use of interpretability tools in machine learning, and how (uh oh) data scientists tend to over-trust them.
Authors: Harmanpreet Kaur, Harsha Nori, Samuel Jenkins, Rich Caruana, Hanna Wallach, Jennifer Wortman Vaughan
Link: on Kaur’s website (to appear in CHI 2020)
Summary
From the abstract:
Interpretability tools have been designed to help data scientists and machine learning practitioners better understand how ML models work. However, there has been little evaluation of the extent to which these tools achieve this goal. We study … the InterpretML implementation of GAMs and the SHAP Python package.
Super interesting! They’re right: I’ve written about interpretability tools before (see Model Cards for Model Reporting, Proposed Guidelines for the Responsible Use of Explainable Machine Learning), but only informally thought about how well they work in practice. It’s all been “that sounds reasonable” or “I don’t know that this would work,” so this paper is timely.
Our results indicate that data scientists over-trust and misuse interpretability tools.
Uh oh.
Study: interviews and contextual inquiry
The authors conduced semi-structured pilot interviews with six data scientists at a “large technology company” (hmm …). The goal was to “surface common issues that arise when building and evaluating ML models.” They identified the following themes:
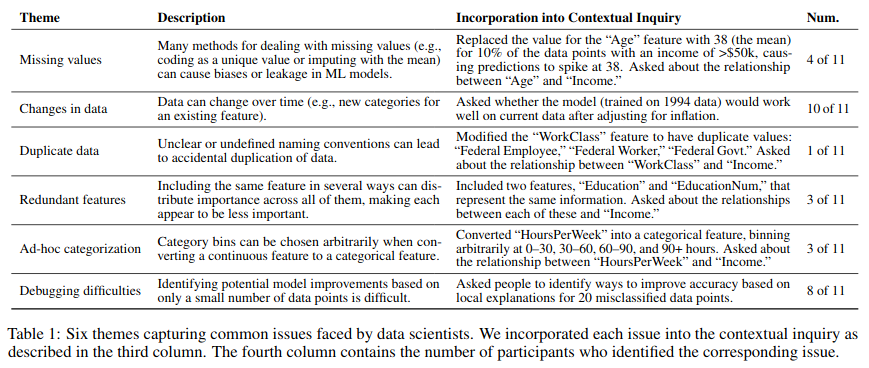
The researchers gave 11 people data scientist-like folks a Jupyter notebook with a dataset (Adult Income dataset), ML model, and interpretability technique (GAMs, which is inherently interpretable, and SHAP, which is a post-hoc technique). They were able to explore the notebook themselves, then were asked questions about the dataset (“what are the most important features according to this explanation?") and about the issues in Table 1 above.
Results: “Our contextual inquiry reveals a misalignment between data scientists’ understanding of interpretability tools and these tools’ intended use.” This misalignment manifests itself in the following ways:
- Overtrusting tools: using interpretability tools to rationalize suspicious observations, or because they hadn’t seen them before. “It’s very transparent, and that makes me trust it more.”
- Undertrusting tools: when they don’t provide the expected clarity. “It’s a visualization. There was no interpretation provided here.”
- A general lack of understanding of how SHAP importance scores are calculated
Social context was important, too: one participant said “this is a pretty popular tool … so it made sense, I suppose” in regards to SHAP, rationalizing explanations that they didn’t fully understand. Additionally, the visualizations themselves were sometimes misleading (by not explaining or giving appropriate context for the meaning of the values they presented).
Study: survey
The goal of this was to quantify the previous findings at a larger scale. Participants were asked the same questions as during the interviews, but this time shown the results of exploration commands and asked questions about the dataset and model. The questions covered “global feature importance, the relationship between age and the output variable, … the local explanation for a correctly classified data point, and the local explanation for a misclassified data point.” Participants were asked a variety of questions, from multiple-choice with an objectively correct answer to open-ended questions designed to test participants’ understanding.
Participants were assigned to either GAM or SHAP, as before, but this time each was stratified into “normal” (where the viz outputs were correct) and “manipulated” (where features were rearranged, so the least important features were displayed as most important). Participants in the “manipulated” conditions were less confident that the results were reasonable, thankfully.
Factors that affect willingness to deploy
One part of the survey asked what makes a model ready for deployment. The themes were:
- Intuition: most participants relied heavily on past experience, sometimes suggesting that they’d ask customers to trust their judgment.
- Superficial evaluation of experiments: using the existence of visualizations to convince themselves. “The charts in combination help you infer reasonable things about the model” or “the top features are reasonable.”
- Perceived suspicions: some participants were suspicious of the models (“what the heck is happening with 37/38 year olds?") or the tests (lack of confidence intervals, overall test scores, etc.). These were the ones who used interpretability tools correctly, to uncover issues that needed further study.
It’s interesting, but not entirely surprising, how much participants rely on their intuition here. They often used the visualizations to confirm their priors, instead of thinking critically about the information presented. The authors call this “a mismatch between participants’ mental models [what users think] of the tools and the conceptual models [what designers think] of the tools.” This was supported by participants’ explanations of the technical details of what the tools provided.
These results indicate that participants did not fully understand the visualizations output by the interpretability tools. However, despite this, they had high expectations for these visualizations, above and beyond these tools’ capabilities.
Wouldn’t it be great if model evaluation were easy? This is a good example of something I’ve encountered a lot in practice: that it’s really easy to convince yourself of the wrong thing based on the mere presence of an explanation. I’m certainly guilty of taking explanations at face value when I later found them to be wrong (based on a bug in my data, model, or visualization).
Implications for design and other thoughts
The authors write that “research on interpretability in the ML and HCI communities has evolved somewhat independently.” It’s not clear how machine learning practitioners use interpretability tools in practice, which is a gap that this paper helped to fill. One of the key findings was that data scientists were unable to fully understand the outputs of existing tools.
There’s clearly a gap between what the tools are built for and how they’re used. Perhaps this means the tools aren’t designed to adequately meet users’ needs, and this is what a human-centered approach might suggest. I suspect, however, that a lot of people in the ML community would take the opposite persepctive and say that it’s the users (data scientists) who should learn how to use them properly.
The question of “how people use tools” is incredibly important. Interpretability is a hot topic, and one that I’m particularly interested in, and it’s great to read a paper that studies how (in)effective interpretability tools are in practice. This helps me to believe in using inherently interpretable models over post-hoc explanations when possible (see Rudin in Nature).
That’s not to say that interpretability tools are bad, of course; but there’s clearly a gap here that needs to be addressed. This is consistent with my experience trying to use them, too. Some researchers propose interactive tools that let users dig into explanations, or that engage deliberative reasoning skills to slow-down decision making. Whatever it is, I’m excited to see where the research goes.